Dashboard
The Dashboard is the central command of your operation in Patagon AI. Here, you can track—in real time—the volume, engagement, qualification, and conversion of leads interacting with your agent through WhatsApp.
The goal is simple: Identify bottlenecks quickly and act before the competition.
Reading the Dashboard is based on three fundamental pillars:
✅ How are we performing today?
✅ Is interest increasing over time?
✅ Are we converting those who show real intent?
The Dashboard organizes your metrics into 3 strategic areas:
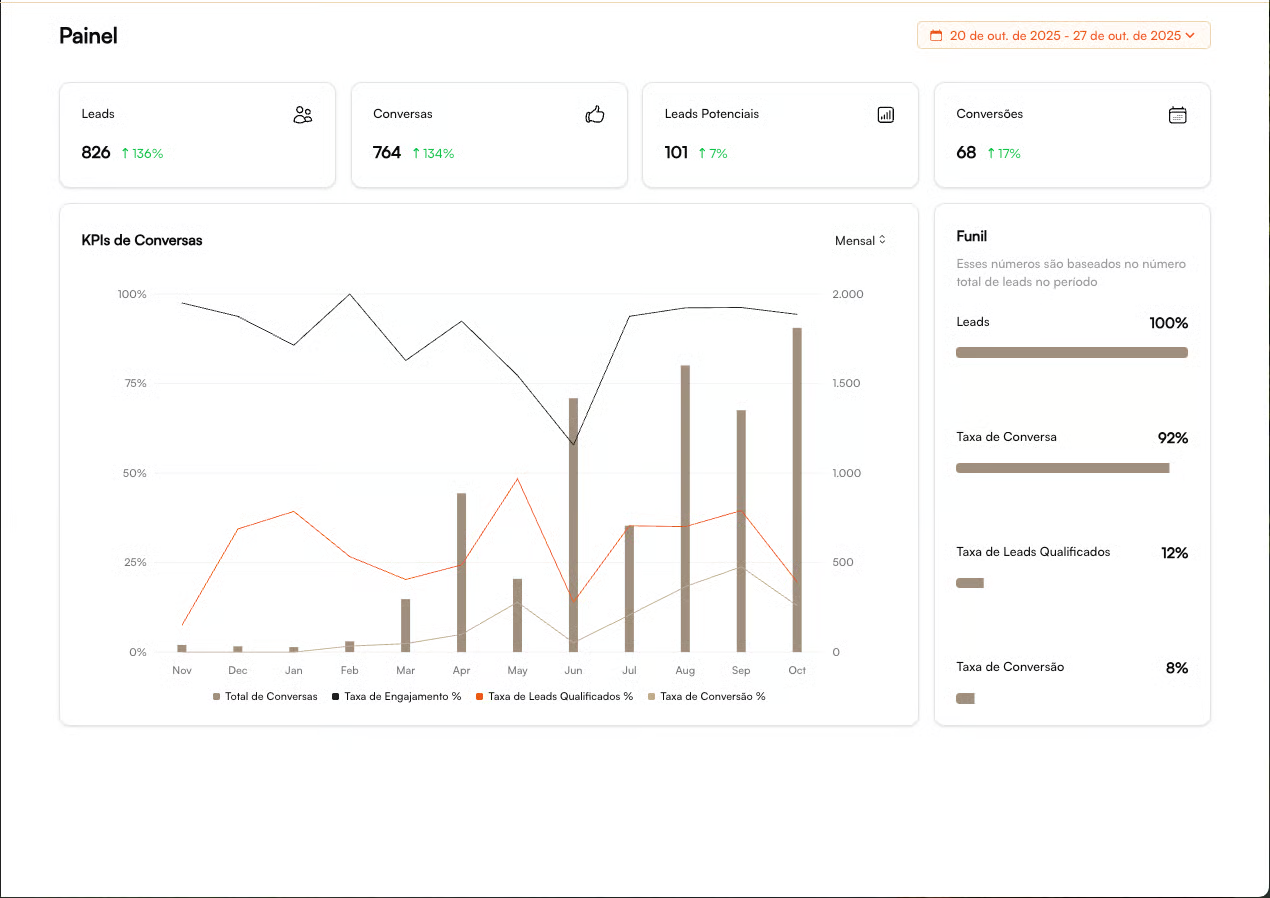
1 — Main KPI Cards
Each card displays the absolute value plus the percentage variation compared to the previous period. The goal is to show whether your critical funnel metrics are growing, stable, or declining.
Interpreting Variations
🟢 Positive Accelerating
🔴 Negative Needs immediate attention
⚪ Stable Monitor trends
Monitored Metrics
KPI
What it Measures
What it Indicates
Leads
Number of leads starting conversations
Top-of-funnel strength / demand generation
Conversations
Effective conversations with the agent
Real lead engagement
Potential Leads
Leads identified with buying intent
Funnel quality and filtering efficiency
Conversions
Scheduled visits / bookings / completed actions
Final outcome of the operation
The stronger the alignment between volume → conversations → qualified → conversions, the healthier your funnel is.
👉 Our Recommendations
Drop in Leads → Review campaigns / traffic
Drop in Conversions → Review sales / script
High Volume of Conversations Without Outcome → Look into qualification
2 — Conversation Evolution Chart
This chart reveals the performance of your conversational funnel over time. Its purpose is to identify trends in volume, engagement, and efficiency.
Element
What It Indicates
How to Interpret
Bars (Conversation Volume)
Number of interactions handled by the agent
Growth = higher demand / effective campaigns
Black Line (Engagement %)
Leads who continue the conversation
A drop may indicate a weak initial approach
Orange Line (Qualification %)
Leads with real buying intent
Shows alignment between audience and the agent’s copy
Beige Line (Conversion %)
Business outcome
Reflects the impact of the sales team's actions
It helps answer the question: “Are we growing at the right pace?”
If interest increases but the number of qualified leads doesn’t follow → review your initial copy, intro script, or audience segmentation.
3 — Conversion Funnel
A complete view of funnel efficiency, from total inbound volume to business results. The stages include:
1️⃣ Leads (100%) → Total funnel entry 2️⃣ Conversations → How many actually interacted 3️⃣ Qualified → Fit + real intent 4️⃣ Conversions → Won opportunities (sale, booked visit, scheduled call, etc.)
Market Benchmark Ranges
These are healthy intervals for each stage of the funnel. Use them as a reference to evaluate whether your operation is within, above, or below market standards:
Conversation Rate: 70% – 90%
Qualification Rate: 30% – 60%
Conversion Rate: 15% – 40%
These ranges vary by segment and value proposition, but serve as excellent indicators of funnel health.
When Something Is Off…
Indicator
Symptom
What to Investigate?
Low Conversation Rate
Low interaction
Initial copy, timing, CTA, segmentation
Low Qualification Rate
Misaligned audience
Qualification criteria, agent questions, lead source channels
Low Conversion Rate
Lost opportunities
Team SLA, sense of urgency, handoff process, follow-up quality
The Patagon AI Dashboard turns data into decisions through:
Clear view of critical KPIs with visual alerts
Trend analysis to anticipate problems
Practical benchmarks for performance evaluation
Fast diagnostics for immediate action
Result: You identify bottlenecks in seconds and optimize your operation with precision.
➜ Next Step
Now that you understand how to read the Dashboard and diagnose your funnel:
👉 Go to Lead Management to act directly on contacts 👉 Or continue to Real-Time Conversations to intervene at the right moment
Last updated