Traffic Source Analysis
The Attribution section in Patagon AI allows you to track, in real time, the origin of WhatsApp conversations and evaluate how each traffic source impacts both the volume and quality of these interactions.
The analysis is organized into three main blocks:
1. Conversations by Source
The bar chart shows the evolution of conversations over time — daily, weekly, or monthly — segmented by source channel, such as Google Ads, Meta, Organic, or Other.
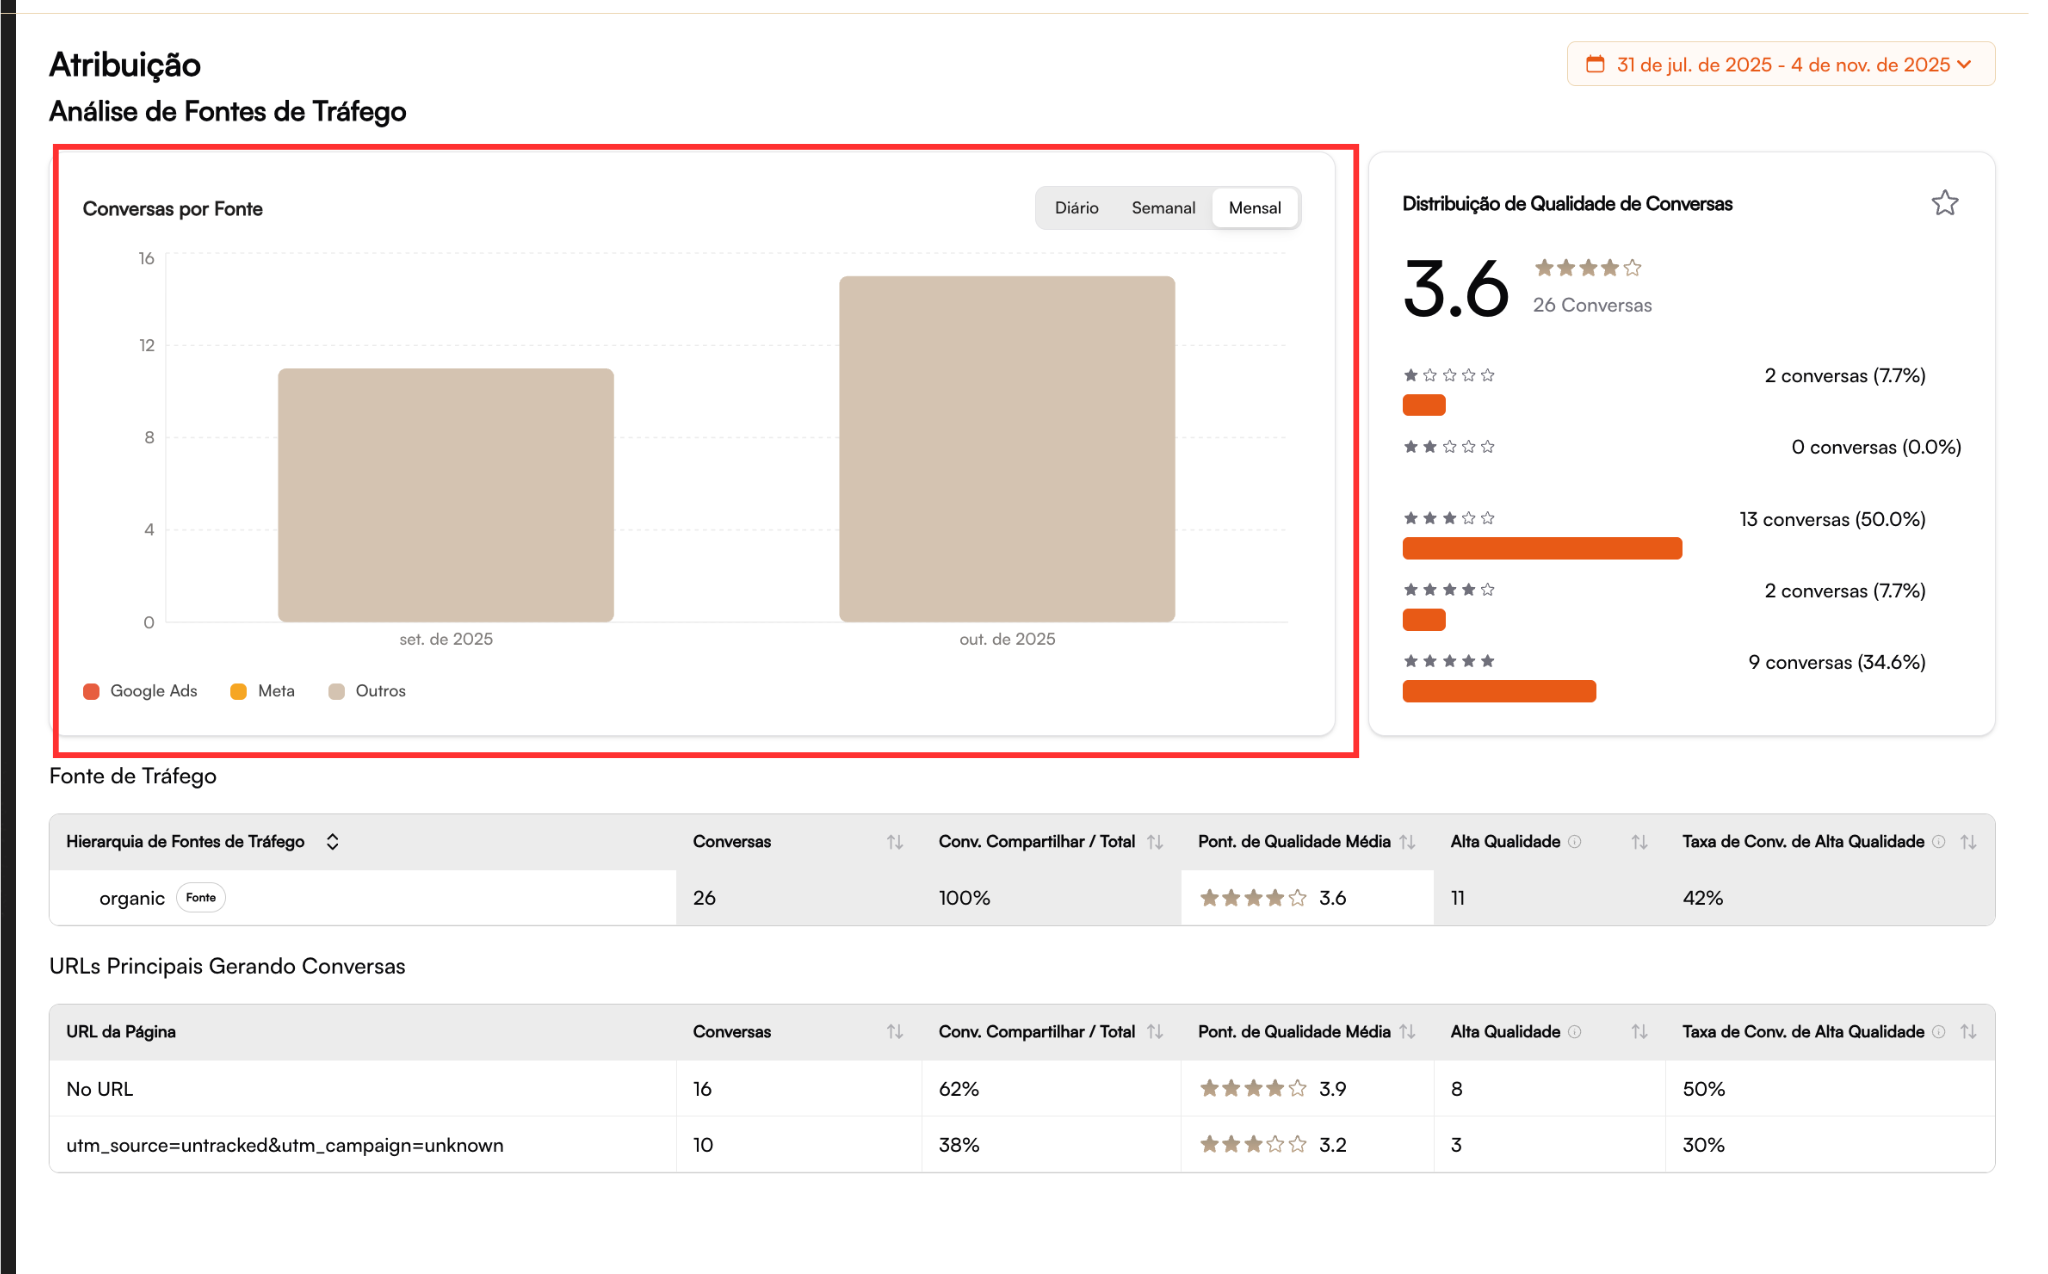
Tip: Use the monthly view for strategic analysis (planning and budget) and the weekly view for tactical monitoring (optimizing live campaigns).
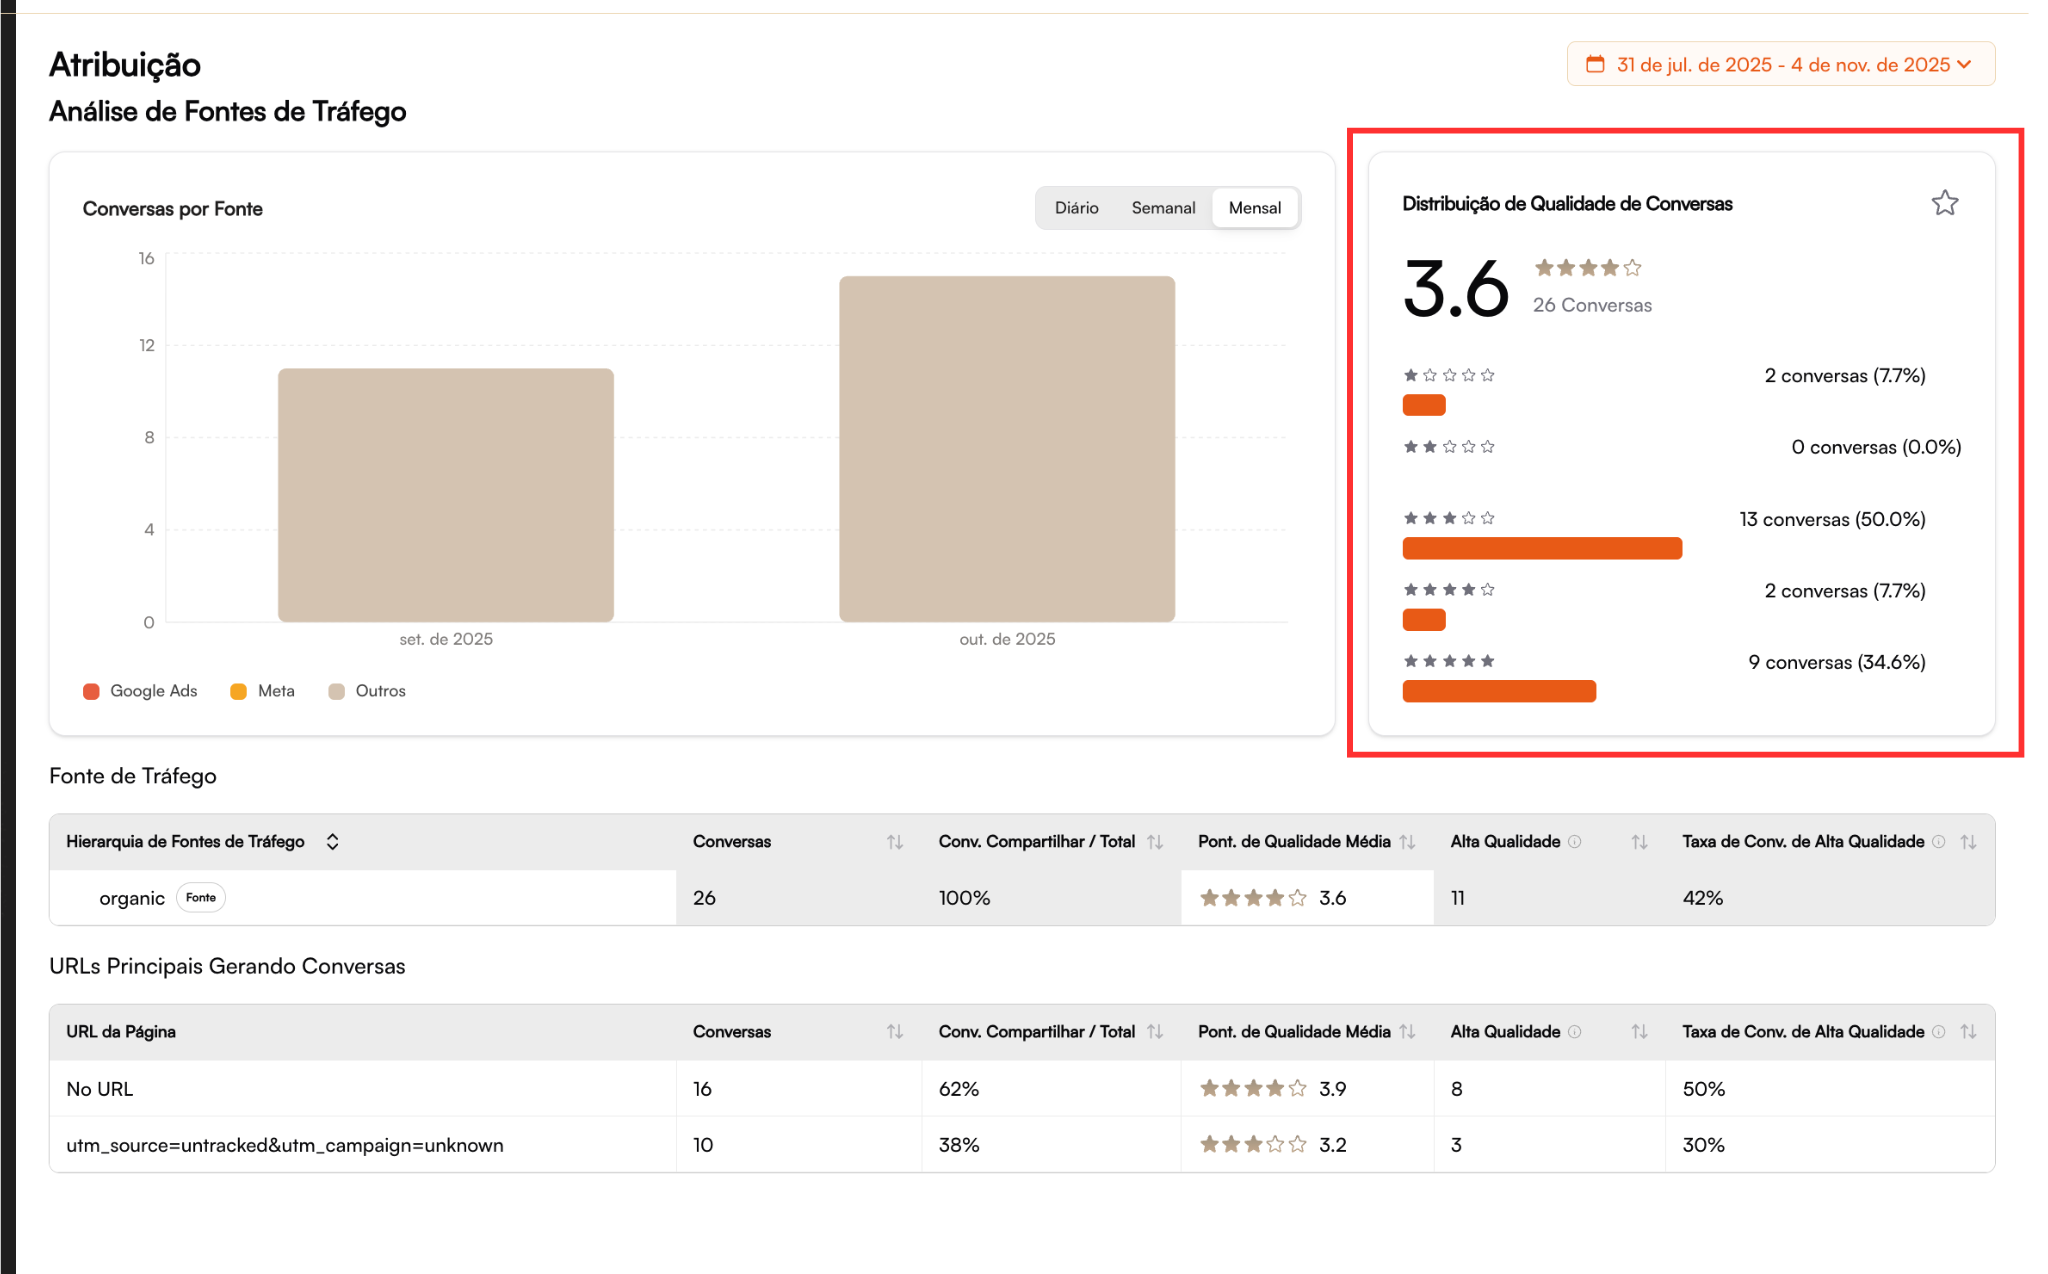
2. Conversation Quality Distribution
A central metric displays:
The average quality score
The percentage distribution across levels (from 1 to 5 stars)
This view helps you quickly identify whether each channel is generating qualified leads or mostly low-value interactions.
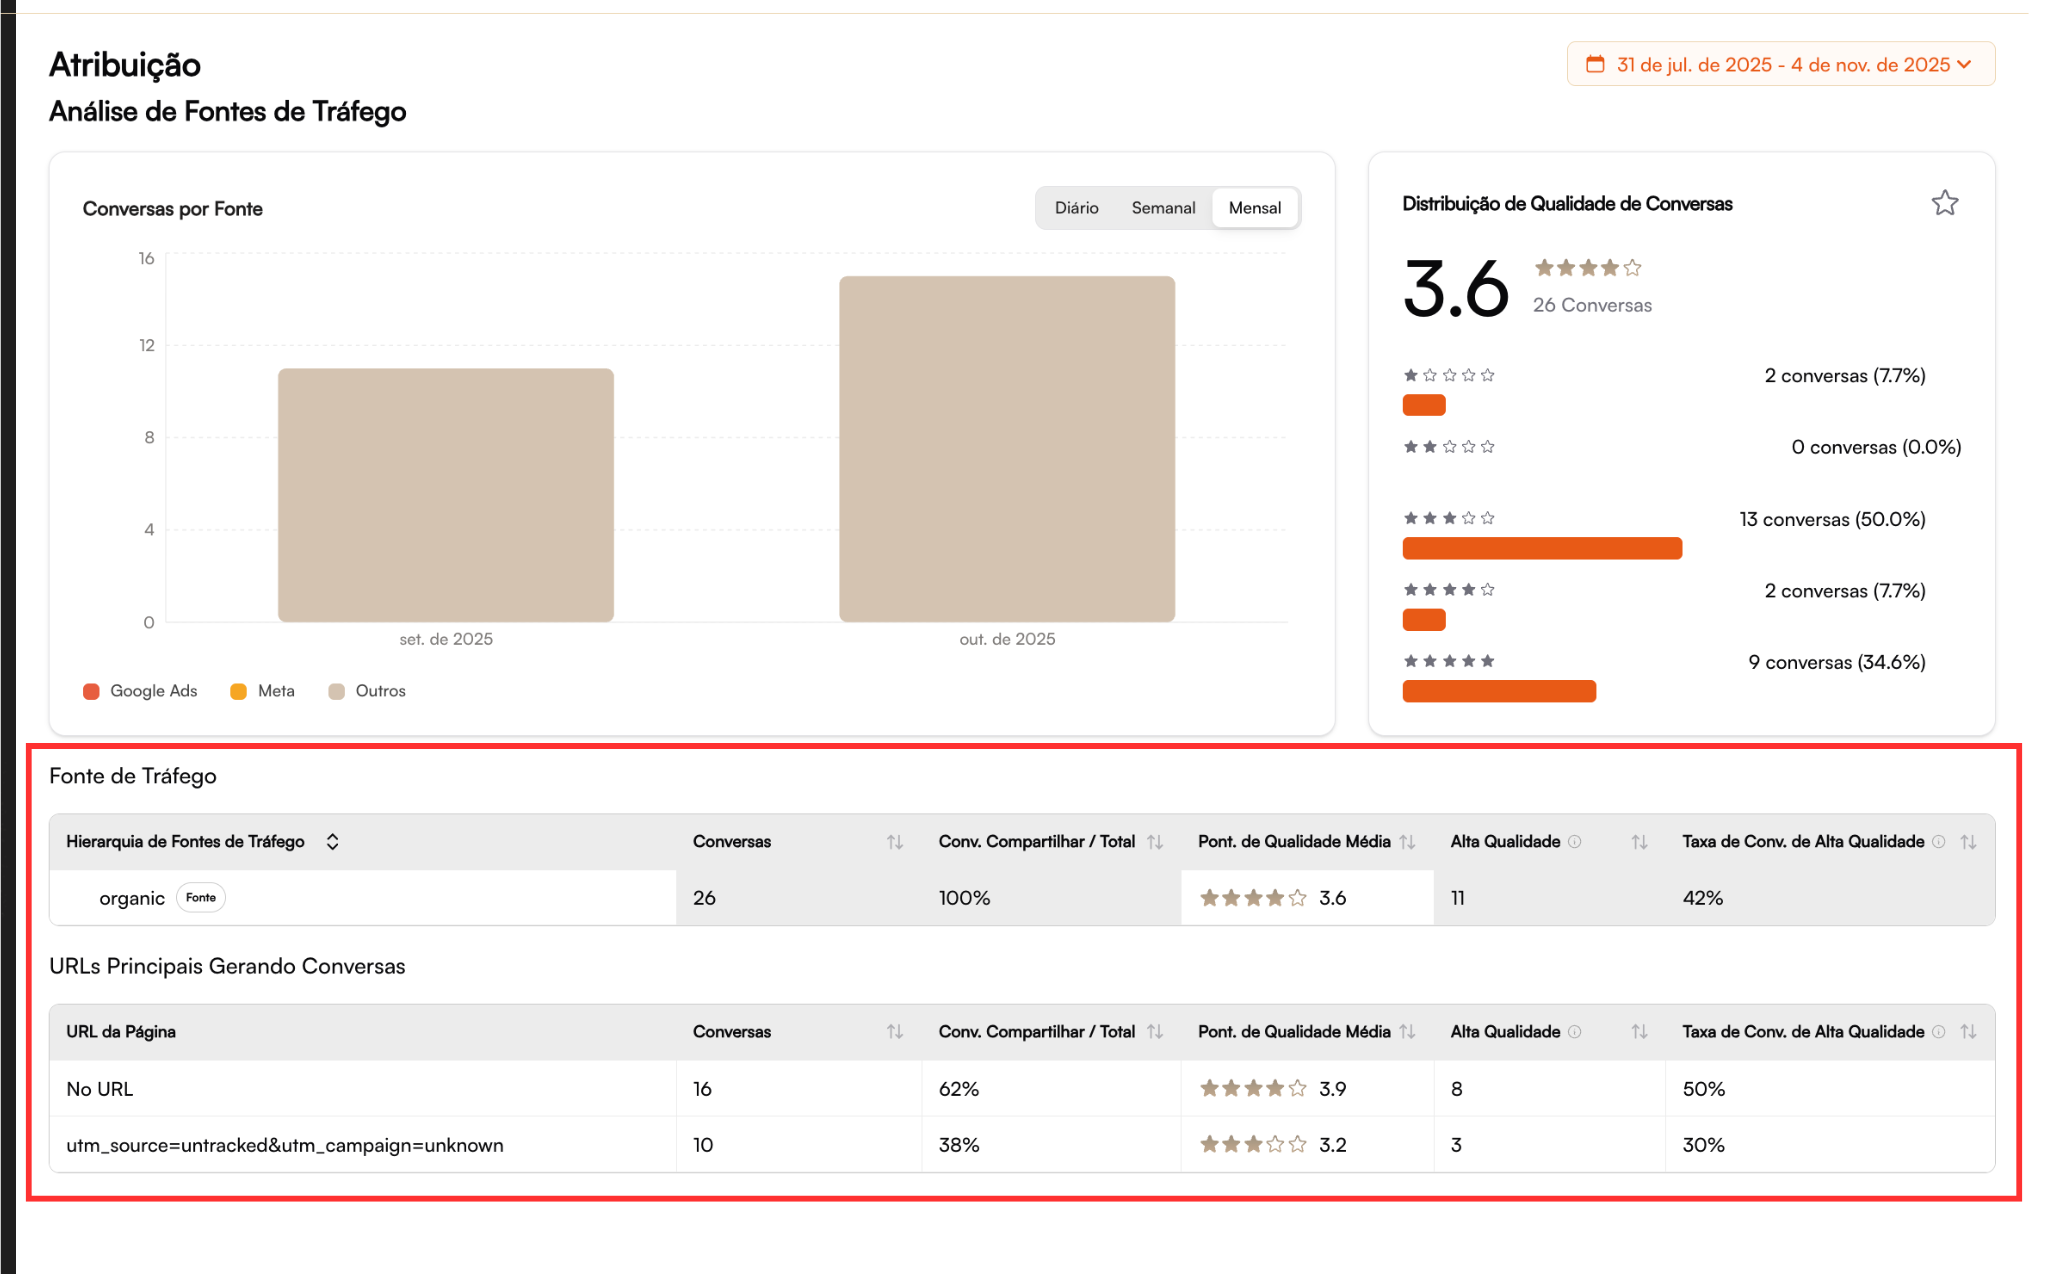
3. Traffic Sources (Detailed Table)
This table presents the full hierarchy of sources (e.g., organic, meta, google) with:
Total number of conversations
Share of total conversations (%)
Average quality score
Rate of high-quality conversations
Practical Example of Analysis
Let’s consider the organic source:
It shows a consistent volume of conversations, but with intermediate quality.
This indicates that, while organic acquisition is active and healthy, there is room to improve lead qualification.
Star distribution:
⭐⭐⭐⭐⭐ → 9 conversations (34.6%)
⭐⭐⭐⭐ → 0 conversations (0%)
⭐⭐⭐ → 13 conversations (50%)
⭐⭐ → 2 conversations (7.7%)
⭐ → 2 conversations (7.7%)
Interpretation
Organic traffic is generating interest, but may be attracting a broad or generic audience.
The absence of 4-star conversations suggests an opportunity to optimize the top of the funnel, such as:
Adjusting keywords and CTAs on origin pages
Reviewing the value proposition or messaging on the website
Directing visitors to more personalized conversation flows via Patagon AI
Tip: A 10% increase in 4 and 5-star conversations can directly improve your final conversion rate — without increasing media spend.
Top URLs Generating Conversations
Below the source table, the dashboard displays the site pages that most frequently started WhatsApp conversations:
No URL
16
62%
⭐ 3.9
8
50%
utm_source=untracked
10
38%
⭐ 3.2
3
30%
Attention: URLs without proper tagging (such as "No URL" or "untracked") limit your visibility into traffic origin, making it harder to optimize campaigns and A/B tests.
How to Interpret the Data
Conversations by Source
Lead generation volume per channel
Average Score
Lead quality and conversion potential
High-Quality Rate
Campaign efficiency in generating relevant conversations
Top URLs
Best-performing pages and campaigns (or tracking gaps)
⚙️ Best Practices
To ensure accurate attribution tracking and consistent analysis in the Patagon AI dashboard, follow these recommendations:
Implement Consistent UTMs
Use
utm_source,utm_medium,utm_campaign, etc. in all campaigns and WhatsApp buttons to enable proper attribution.Integrate the Patagon AI Attribution Script
Automatically capture origin and session data (clicks, referrals, and campaign IDs), ensuring precise tracking even for direct/organic access.
Monitor Quality Changes Over Time
Drops in average score may indicate:
Changes in target audience
Creative alterations
Relevance issues on landing pages
Use Time-Based Filters Wisely
Switch between Daily / Weekly / Monthly views to:
Correlate performance with launches, promos, and budget shifts
Identify short-term anomalies vs. long-term trends
Review Sources and URLs Weekly
Identify optimization opportunities
Fix tracking issues (URLs without UTMs)
Adjust campaigns based on actual conversion data
Create an internal checklist to validate UTMs and parameters before launching new campaigns. This prevents attribution gaps and keeps analytical consistency across teams and channels.
Last updated